Note on the Sources of Information and Our Non-Medical Qualifications: Modeling for this paper is based on standard analytics used in Physics, Engineering, Medicine and many other disciplines. The results from an example case study are summarized below. Data from a number of sources are incorporated in this study and those sources are cited at the end of the D-score and T-score report. While none of the Farlite Solutions team are physicians or experts in the various disciplines of medicine, we are respectful of their published peer reviewed reports. We have cited those from which we derived specific information.
D-Score vs. T-Score
D-Score and the T-Score are different in that they present entirely different kinds of information. D-Score reports a dose that is delivered and the percentage quantifies the percentage of pathogens a particular lamp can “kill” at a dose rate produced by the lamp and an exposure duration supposed at that location. The D-Score value is radiation dose and the expected percentage of pathogens inactivated or killed at a specific location. It is usually written as:

Farlite Solutions created the T-Score (T represents the “Threat of Infection”) because the D-Score does not deliver the information required to predict infection risk associated with occupation of spaces. A T-Score, which is based on actual measurements of the above parameters throughout the space, is calculated and predicts the risk of infection an occupant might experience for a specified period of occupancy. A T-Score looks like this:

FarliteSolutions’s approach to inactivation of aerosol pathogens incorporates a measurement-based understanding of the ever-changing upper-air velocity in a protected space in addition to a detailed understanding of irradiance levels (dose rate) throughout the upper air. It also incorporates monitoring of the humidity since some aerosol pathogens may be more or less sensitive to humidity. These parameters among many are monitored in all upper-air spaces where FarliteTM UVPhasor® operate.
Farlite Solutions needed to be able to forecast the probability that a person could remain in a protected space safely with Farlite’s continuous upper-air cleansing process in operation. Farlite needed to be able to predict the probability of occupants developing a symptomatic infection during some stay.
The truth is that we are breathing very tiny floating pathogens all the time. The tiniest are called aerosolized pathogens and they can float in the air for a long time. They can do great damage since they are inhaled and may even get to the lungs if they are small enough. For this and other reasons they may be quite hazardous. Typically, pathogenic aerosols ultimately become ineffective after a few days. Of course, other infectious carriers may visit the space and unknowingly spread a further dose of pathogens. Our technology has to sufficiently eradicate pathogens to make infection probability essentially de minimis.
Medical research has shown that each different aerosolized pathogen can cause a symptomatic infection when some minimum level of pathogens has been accumulated. The human body has powerful tools that will eliminate invading pathogens. Our bodies will prevent significant symptoms if the body can react fast enough to prevent the accumulation of the requisite number of active pathogens required for a symptomatic infection. A low rate of arrival of pathogens gives our bodies more time to block an infection.
The Farlite™ approach is to reduce the number of active pathogens afloat in the air we breathe. Our approach reduces the concentration of pathogens in the upper-air to such a low level that when the air is recycled to the lower-air, the probability of infection becomes remote. Calculating the T-Score of the space requires continuous measurements of irradiance (lamp energy) and air velocity.
Our operational practice will limit pathogen concentrations to an extremely low level and maintain it continuously so that symptomatic infection remains a remote probability for uninfected persons or asymptomatic persons. T-Score is a meaningful performance metric for Germicidal Ultraviolet Inactivation systems like Farlite’s UV Phasor because it gathers the data required to project the probability of infection for any stay-time based on the site and the installed service. The calculation is complex because:
- pathogen concentrations are very subjective due to a lack of technology capable of collecting needed real-time data on the pathogen concentrations,
- it is very dependent on the mixture and quantity of pathogens with varying sensitivity to UV light,
- the incubation period of pathogens varies with the pathogens and
- since technology is not available to capture concentration levels and compositions of pathogens is any way close to real time, then one must utilize a very powerful system to create the right level of UV light irradiance.
Farlite’s UV Phasor is a patented, high power, computer-controlled projector of UVC designed for just this purpose.
T-Score technology is new but based on solid findings of:
- Physics and the properties and behavior of light,
- Advanced data science utilizing real-time modeling and analysis to calculate T-Score values,
- Advanced engineering of sensors and monitoring, communications and computing power based on the “Senz Data Collection and Remote Monitoring Module” required to inform T-Score projections of safe stay-times and implement Cloud adjustments as conditions change and
- medical research data from peer reviewed articles that may be used to configure service parameters.
This will materially go beyond the limitations in performance of legacy lamp-by-lamp approaches to germicidal UV Light Inactivation of aerosolized pathogens. Aerosolized COVID-19 demonstrated the need to have this capability to protect people.
Demonstration of D-Score and T-Score Test Case
The following Demonstration Test Case illustrates the power of the FarliteTM approach. It imagines a sample facility with a horrendous load of pathogens. It projects what a properly engineered system should achieve by inactivating aerosolized pathogens.
Data for the Demonstration Test Case
- Consider a demonstration test case of a building of 500,000 sq. ft. with an interior height of 25 ft. One can multiply these two numbers to get a volume of 12,500,000 cu. ft., which we convert into 353,960,625 half liters (hl.).
- We convert to half liters because adult humans have an average breath of about ½ liter (half liter). The average adult will take from 10 to 20 breaths per minute under normal conditions. We assumed in our test case that the occupants were heavy breathers and took 20 breaths per minute or 1200 breaths per hour.
- The building ventilation system conforms to code and cycles the air volume six times per hour or every ten minutes.
- The assumed stay-time of occupants in the building is at least 4 weeks at 60 hours per week.
- We assumed an unbelievable initial pathogen load in the building at the time of system startup, the time at which the model starts, of 10 trillion (10,000,000,000) pathogens of which all were active.
- We assumed that we could inactivate 82% of these pathogens per cycle, a very low number, through the ventilation system.
- We assumed that there were enough symptomatic carriers in the facility to add 100,000,000 (100 million) active pathogens to replenish those inactivated each cycle through the ventilation system.
- It has been reported that a dose of 280 COVID virions is the minimum dose to infect a female adult, 200 COVID virions to infect a male adult and 138 COVID virions to infect a child. (See References).
Results of Test Case:
Where did the pathogens go?
 The graph below shows what happens to the pathogens in the air over time beginning when the Farlite system is first turned on. Starting at 10 trillion pathogens the ventilation cycle reduces the pathogens by 82% every 10 minutes. The first cycle reduces the pathogen count by eight trillion and receives one hundred million active pathogens. After five intervals (1 hr.), the pathogen count is reduced to 151 pathogens per cubic foot or three pathogens per half liter. The exact values are in the shaded inset to the chart.
The foregoing chart shows how the overall pathogen population fared with Farlite technology. The next chart presents the same chart but omits data prior to one- and one-half hours of operation since that initial cleansing time is a one-time event. The following chart is more important since it reflects the presence of occupants. The scale provides more resolution in the counts of pathogens.
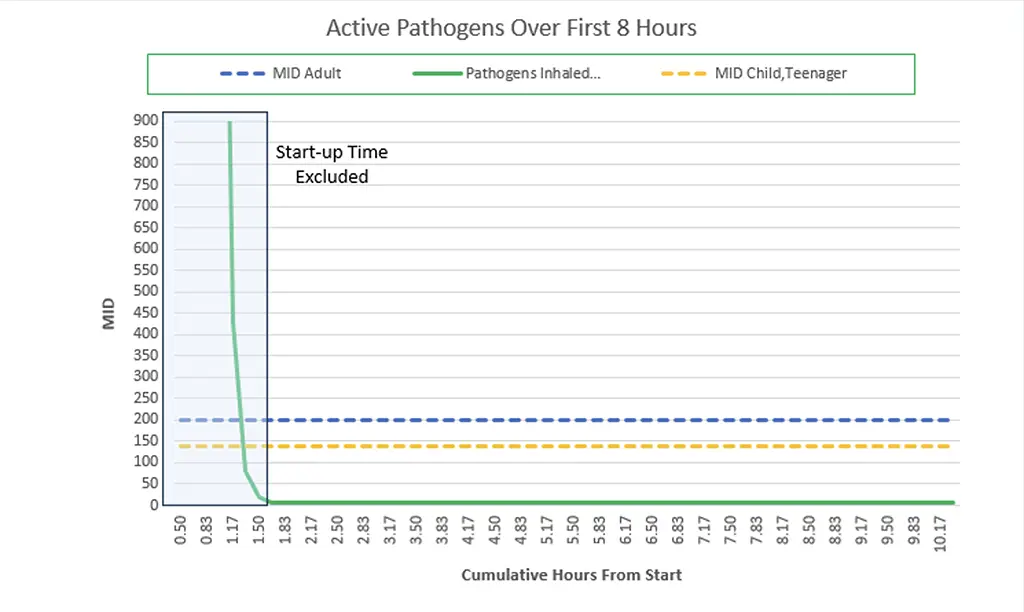 What is the risk to people?
In the chart below, two dashed lines represent the Minimum Infective Doses (MID) of adult males and children. Within the first one- and one-half hours, the pathogen count fell below those values. Over time it appears to fall to zero. Effectively it falls so low that it appears to be zero, but it is not. What happens is that the concentration of pathogens per cubic foot is such that there is only one pathogen for just over every 1600 cubic feet. It is very unlikely that an occupant will experience the Test Case long term density of pathogens.
Note that the average density of pathogens after the first one- and one-half hours is maintained indefinitely. The above two charts illustrate Farlite’s system ability under the onslaught of 100,000,000 pathogens every 10 minutes while defeating an initial 10 trillion active pathogens. The is an extreme case and unlikely to ever occur.
Conclusion:
Farlite’s patented UVPhasor® permits designs around the requirement to protect occupants from the risk of picking up more pathogens while occupying a space. This does not mean that a person will not acquire one or two pathogens during a visit but even that potential is unlikely.
The T-Score is useful because it translates detailed informatiion about the entire space including lamps, D-scores, Air Velocity, and other parameters into useable predictions of safety based on stay-time in a space. Once technology necessary to make the calculations is in place this is achievable. Admittedly, it is a lot of data and requires a Cloud for storage and powerful computers to perform the calculations. It also requires an intelligent lamp system that collects the data and ships it to the Cloud where it can be processed. Configuration changes are determined and sent to the UVPhasor® where they are appropriate.
Farlite’s view is that our solution is best presented as a service to shield customers from the complexity of the technology and the need for real time analysis and response. Farlite’s solution is generally available only as a service because we perceive a duty to make every customer pleased with its service and support. Farlite’s service is comprehensive and includes all maintenance, lamp replacement, and installation during the comprehensive warranty period.
Key References:
- 2022 Aug 11 by SAGE Open Medicine 2022; 10: 20503121221115053 Minimum infective dose of Severe Acute Respiratory Syndrome Coronavirus 2 based on the current evidence: A systematic review.
- Born and Wolf, Principles of Optics, 3rd Edition, Pergamon Press (1965)
- Wladyslaw Kowalski, Ultraviolet Germicidal Irradiation Handbook, UVGI for Air and Surface Disinfection, DOI: 10.1007/978-3-642-01999-9, © Springer-Verlag Berlin Heidelberg 2009
- Task Force of International Ultraviolet Association, “Far-UV-C Radiation: Current State of Knowledge” White Paper , International Ultraviolet Association (IUVA), 2021
- SAGE Open Med, “Minimum Infective dose of severe acute respiratory syndrome coronavirus-2 based on current evidence: A systematic review”, Online 2022, August.
- Chuck Dinerstein MD, “Counting COVID 19: How Many Virions Does It Take?”, American Council on Science and Health, June 2021.
- Jos Lelieveid, Frank Helleis, Stephan Borrmann, Yafang Cheng, Frank Drewnick, Gerald Haug, Thomas Kilmach, Jean Sciare, Hang Su, and Ulrich Poschi, “Model Calculations of Aerosol Transmission and Infection Risk of COVID-10 in Indoor Environments”, International Journal of Environmental Research and Public Health”, Online Nov.2020.
- Stephen A Lauer, MS, PhD, Kyra H. Grantz, BA, Qifang Bi, MHS, Forrest K Jones, MPH, Qulu Zheng, MHS, Hannah R. Meredith, PhD, Andrew A. Azman, PhD, Nicholas g. Reich, PhD, and Justin Lessier, PhD., “The Incubation Period of Coronavirus Disease (2019) From Publicly Reported Confirmed Cases: Estimation and Application”, Annals of Internal Medicine,2020 Mar.
General Information Sources from Wikipedia Listed by Report Title:
This is general background information that may be helpful to your study of the above references.
- Infection
- Virus
- Minimal Infective Dose
- Lung Volumes
- Latent Period